21 Jun 2026
Mapping Behavioral Trends in Digital Betting Through Aggregated User Data Analysis
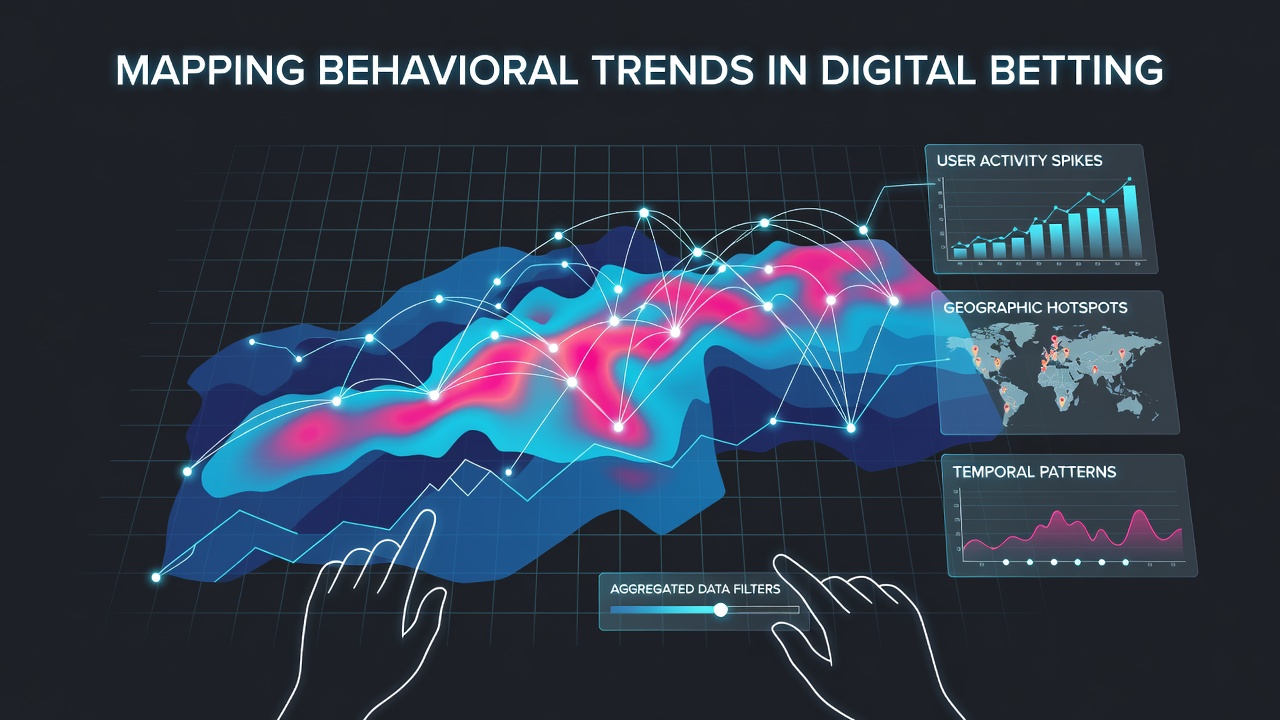
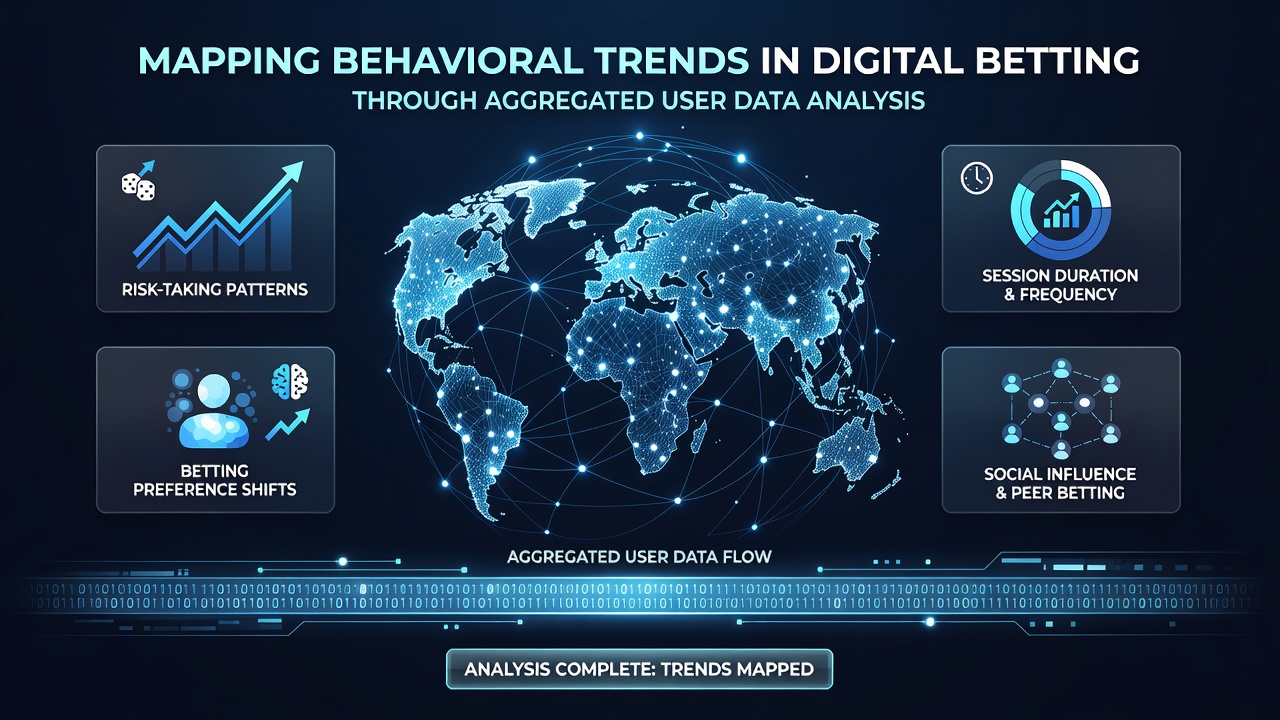
Digital betting platforms generate vast quantities of user interaction data each day, and analysts now apply aggregated datasets to identify recurring behavioral patterns without accessing individual identities. This approach relies on anonymized transaction logs, session durations, and wager frequencies collected across multiple operators, which allows researchers to track shifts in participation rates and preference changes over time. Aggregated analysis reveals how external factors such as regulatory updates, sporting calendars, and mobile interface modifications influence collective user conduct across regions.
Data Sources and Collection Frameworks
Operators compile records from mobile applications and desktop interfaces that include deposit amounts, withdrawal timings, game type selections, and bonus redemptions. These raw figures undergo aggregation by third-party analytics firms that strip personal identifiers before releasing summary statistics to academic teams and regulatory bodies. In June 2026 several European and North American platforms contributed to a shared dataset covering more than 180 million sessions, enabling cross-border comparisons of engagement spikes during major soccer tournaments and horse racing meets.
Research teams at institutions such as the University of Nevada, Reno have developed standardized metrics that measure average session length alongside frequency of limit-setting tool usage. These metrics feed into dashboards that display regional differences in deposit velocity and game-switching behavior, providing operators with benchmarks rather than prescriptive advice.
Identified Patterns in User Engagement
Aggregated figures show consistent peaks in live sports betting activity during evening hours in time zones aligned with major league fixtures, while slot and table game sessions tend to cluster around midday and late-night windows. Data further indicates that users who activate responsible gaming features early in their tenure maintain steadier deposit patterns compared with those who delay activation. Analysts note that multi-game switching within single sessions has risen steadily since 2024, reflecting interface improvements that allow seamless transitions between live dealer streams and in-play odds boards.
Seasonal variations appear clearly in the numbers. Summer months register elevated mobile participation linked to outdoor sporting events, whereas winter periods correlate with increased desktop usage during indoor league schedules. Aggregated datasets also capture the impact of promotional timing, showing that bonus drops issued within 48 hours of major matches generate higher redemption clusters than those released during quieter periods.
Regional and Demographic Variations
North American datasets compiled through the American Gaming Association reveal higher average wager sizes on mobile devices in states with recently legalized markets, whereas established markets display more stable per-session amounts. Australian research coordinated by the Australian Institute of Family Studies documents distinct patterns in jackpot participation, with users in remote areas favoring longer session lengths on progressive slot titles compared with urban cohorts.
European operators contributing to pan-regional studies report that payment method preferences shift according to local banking regulations, with instant bank transfer users demonstrating faster fund turnover cycles than those relying on card or e-wallet options. These geographic distinctions emerge only after aggregation across thousands of accounts, underscoring the value of large-scale datasets that smooth out individual outliers.
Analytical Tools and Privacy Safeguards
Machine learning models trained on aggregated time-series data detect anomalies in collective behavior, such as sudden surges in withdrawal requests following regulatory announcements. Privacy frameworks require that no model receives inputs finer than cohort-level summaries, preventing re-identification while still allowing trend detection. Platforms that adopted differential privacy techniques by early 2025 reported sustained user trust metrics alongside continued data utility for trend mapping.
Dashboard interfaces present these findings through heat maps of activity density and Sankey diagrams tracing movement between product categories. Operators review the outputs to adjust server capacity during anticipated high-traffic windows rather than to target specific individuals.
Outlook Through Mid-2026 and Beyond
By June 2026 the integration of real-time sports data feeds with historical betting logs had already produced predictive models for aggregate volume spikes around international tournaments. Continued expansion of 5G networks in emerging markets is expected to accelerate mobile session counts, particularly in regions where regulatory frameworks now require routine submission of aggregated activity reports to oversight agencies. Academic consortia continue refining cross-platform matching algorithms that link anonymized records across operators, further sharpening resolution of long-term behavioral trajectories without compromising user confidentiality.
Conclusion
Aggregated user data analysis supplies operators, regulators, and researchers with measurable indicators of how digital betting populations respond to technological, regulatory, and seasonal influences. The resulting maps of behavioral trends support capacity planning, policy evaluation, and academic inquiry while maintaining the separation between collective patterns and personal records that privacy standards demand.